Using OLAP Cubes
OLAP stands for online analytical processing. An OLAP cube is a type of object that can be included on a dashboard which makes it very easy for users to change how the data is presented on the screen. The DataBlock designer defines certain dimensions, e.g., attributes that the data can be sorted on, and what the measures are (the counts, amounts, or other numbers that are being measured). The report viewer can then pick and choose at run time which dimensions they want to use, and how the data should be broken down.
For example, suppose there is a company that sells IT equipment. They have 12 salespeople, each of whom works in a particular region of the country. It would be nice to know things such as:
- Who sells the most in each region?
- Which regions are the most and least profitable?
- Which salesperson makes the most sales? The fewest? Who sells the highest and lowest amounts?
- Does a particular product sell better in the Midwest vs. the South?
- Which products sell best? Worst?
- Are there products that sell better at certain times of year?
- For each salesperson, have sales increased or decreased from time last year?
Determining all of this information would most likely require a large number of spreadsheets showing various data depending on the question you are trying to answer. OLAP cubes allow you to drag and drop dimensions, then filter, group, and sort the data to get the information you need quickly and easily. They have sometimes been called "a million spreadsheets in a box" because of how easily they can be rearranged to convey completely different information.
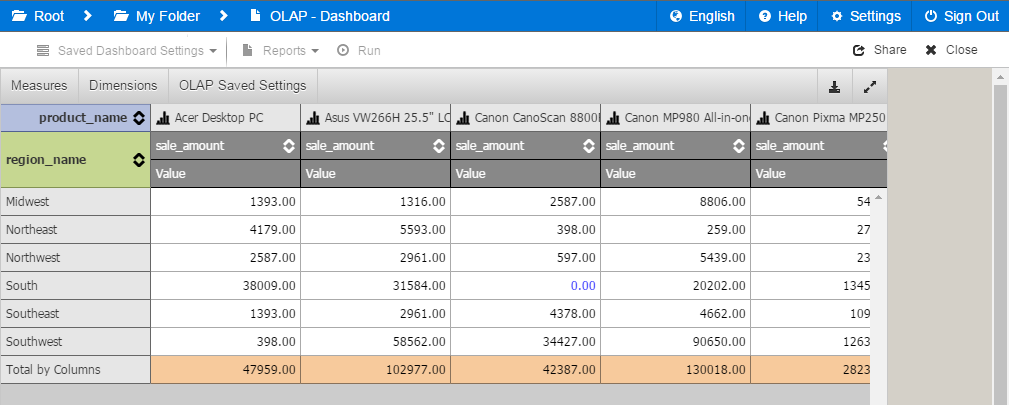
When you first load an OLAP cube, you will see data in its default view as configured by the DataBlock Designer.
If this cube has previously-saved OLAP settings, you can load them by clicking on the OLAP Saved Settings button at the top of the cube. This dropdown displays any saved settings that you created, as well as ones created and shared by other users.

After loading a saved OLAP setting, the name of the setting will appear at the top of the cube.
Note: The Web Viewer currently only supports loading existing saved OLAP settings. New saved OLAP settings can be created in the Argos client. The Argos client also allows you to "pin" a saved OLAP setting as the default view that will be loaded when running the DataBlock.
Dimensions
Click the Dimensions button to configure the cube. The Dimension Editor has lists of the available and displayed dimensions. You can click and drag each dimension into the Columns or Rows lists, or drag it back into the Available column to remove it from the cube.

Click the gear icon to access advanced configuration for each dimension.

You can choose to enable Previous or Next Forecasting, which extrapolates one additional data point in each direction ("preceding" and "consequent" values). Argos supports several different forecast calculation methods, which you can choose from the dropdown list.
Argos provides six different forecasting algorithms for you to choose from:
- No forecasting - Do not include any forecasted values in the data.
- Moving average - The best-known forecasting method is the moving averages method. It simply takes a certain number of past periods and adds them together, then divides the result by the number of periods. Simple moving averages (MA) is an effective and efficient method provided the time series is stationary in both mean and variance. The following formula is used in finding the moving average of order n, MA(n) for a period t+1:
MAt+1 = [Dt + Dt-1 + ... +Dt-n+1] / n
where n is the number of observations used in the calculation. - Weighted moving average - Very powerful and economical. It is widely used where repeated forecasts require methods like sum-of-the-digits and trend adjustment methods. An example of a weighted moving averages calculation is as follows:
Weighted MA(3) = w1.Dt + w2.Dt-1 + w3.Dt-2
where the weights are any positive numbers such that: w1 + w2 + w3 =1. Typical weights for this example are: w1 = 3/(1 + 2 + 3) = 3/6, w2 = 2/6, and w3 = 1/6. - Double/Triple exponential smoothing - One of the most successful forecasting methods is the exponential smoothing (ES) method. While the simple MA method is a special case of the ES, the ES is more conservative in its data usage. It also offers the following advantages:
It can be modified to be used effectively for time series with seasonal patterns.
It is easy to adjust for past errors.
It is easy to prepare follow-on forecasts, which are ideal for situations where many forecasts must be prepared and several different forms are used depending on the presence of trend or cyclical variations.
In short, an ES is an averaging technique that uses unequal weights, where the weights applied to past observations decline in an exponential manner, as follows:
Ft+1 = a Dt + (1 - a) Ft
where:
Dt is the actual value
Ft is the forecasted value
a is the weighing factor, which ranges from 0 to 1
t is the current time period.
Notice that the smoothed value becomes the forecast for period t + 1.
A small value for 'a' provides a lot of smoothing while a large value provides a fast response to the recent changes in the time series and a smaller amount of smoothing. Notice that the exponential smoothing and simple moving average techniques will generate forecasts having the same average age of information if moving average of order n is the integer part of (2-a)/a.
An exponential smoothing over an already-smoothed time series is called double-exponential smoothing. In some cases, it might be necessary to extend it to triple-exponential smoothing. While simple exponential smoothing requires stationary condition, the double-exponential smoothing can capture linear trends and triple-exponential smoothing can handle almost all other business time series.
- Show only min/max values - The "Preceding" and "Consequent" fields will contain the min and max values that appear in that row or column.
- Show first and last values - The "Preceding" and "Consequent" fields will repeat the first and last values that appear in that row or column.
Note: If a dimension has fewer than three data points, the forecasting value will be 0 as there is not enough information to extrapolate a value. Forecasted values are not part of the cube data, so some views of the measure (like ranks, record count, prev/next items, etc.) will be 0 when applied to rows or columns with forecasted values. Forecasted values are not included in total/subtotal calculations, but are included in running total calculations.
The Dimension Editor also allows you to set up custom groups of values and to filter or hide unwanted values from the cube.
- Click + New Group to add a group, which you can then name as desired. Drag and drop values from the root list into the new group(s) until they appear as you want them.
- Clicking on the eye icon next to each value toggles it between the visible, invisible, and filtered states. Invisible values are not displayed in the cube, but the data associated with that value is still included in the totals. Filtered values are neither visible nor included in the totals.
- When viewing the cube, if any dimensions have invisible or filtered values, the Dimensions button is highlighted in blue or red, respectively. When the Dimension Editor is open, the names of the dimensions similarly show the color coding to indicate the presence of invisible and filtered values.

Dimensions containing both filtered and invisible values are also shown in red.
Measures
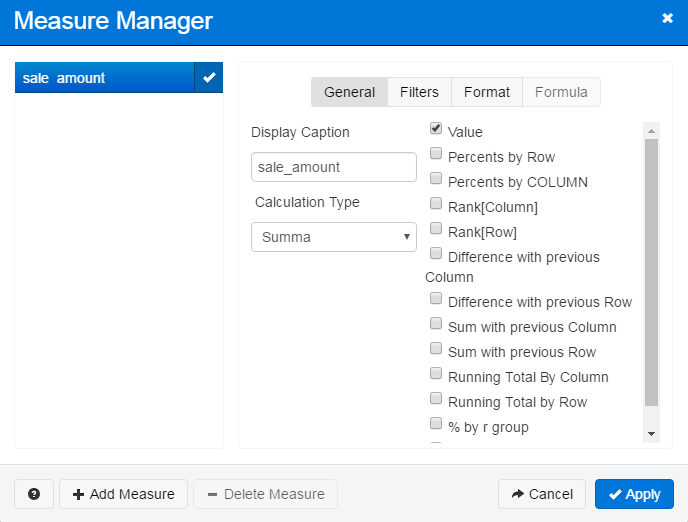
Measures are the sums, totals, or other calculations that display in the OLAP cube. They are the information you are looking for based on the dimensions. Click Measures to open the Measure Manager where you can define which measures appear in the cube and how they display. Use the Add Measure button to create customized additional measures.
When a measure has min/max value filters applied, the Measures button at the top of the OLAP cube appears in red to indicate the presence of filtering.
Viewing Data
Once the cube has been constructed, you can use the following buttons to sort, expand, or view graphical data.
| Icon | Description |
|---|---|

|
Expand dimension. Only visible when there are additional sub-dimensions under a dimension. |

|
Sort by measure. |

|
View chart. |
To expand the OLAP cube to use the full window, click the  button in the upper right of the cube.
OLAP Charts
Clicking the chart icon at the top of any column in an OLAP cube brings up a graph of the data for that column. In the first example above, the columns in the OLAP cube show a list of sale amounts for each product. Clicking the chart icon next to the Asus VW266H 25.5" LCD Monitor brings up the following graph:

- Columns - Click the left or right arrows to see the graph for the previous or next column in the OLAP cube.
- Rows - Select the row(s) you want included in the chart.
- Measures - Select the measure(s) you want included in the chart. Each measure is a new chart series.
- Views - When you configure your measures, you can include one or more views for the data in the OLAP cube. For example, you can interpret the data as a plain value; display percents by row or column; show the difference with previous rows or columns; etc. The Views drop down allows you to choose which of the enabled views to display in the chart.
- Chart Type - Change the chart type. You can view OLAP charts as column, line, point, pie, or area charts. Note: If you select more than one measure, you will not be able to select a pie chart as this type of chart can only display one series at a time.
Exporting OLAP Data to Excel
To export the data currently being shown in the OLAP cube, click the Export to Excel button in the upper right of the cube, next to the Fullscreen button: 
This will download an .xlsx file to your machine. Unlike in previous versions of Argos, you do not need to have Microsoft Excel installed to download the file. Once the download is complete, you can then open the file in a spreadsheet program of your choosing.
